
Detecting damage in structures by the way they vibrate
How autoencoders, convolutional neural networks, and camera measurements can detect, locate, and quantify structural damage.
Table of contents
Note: This post is an AI-assisted summary of the three main papers I have worked on during my research program at the university. While the content may have been mostly generated by AI, the work it is based upon was fully developed by me and my professors/coauthors.
Introduction
A vibrating beam carries information about its condition. Introduce a crack, and its stiffness changes. That change affects how the beam moves and bends. The challenge is turning those measurements into useful answers: has something changed, where is the damage, and how severe is it?
Across three papers I coauthored, my collaborators and I explored these questions using autoencoders, convolutional neural networks, and experimental vibration measurements. The work ranges from accelerometer data collected on a bridge to displacement measurements extracted from video of a laboratory beam.
The thread connecting these studies is the representation of the data. We moved from compressed frequency-domain signals, to displacement time histories, to the shape of a beam at a single instant. Each representation supports a different way of learning about structural damage.
You can download all three papers below.
Detecting changes in the Z24 bridge
In our CILAMCE 2022 paper, we investigated damage detection using measurements from the Z24 bridge in Switzerland. Before its demolition, the bridge was instrumented and progressively damaged, providing an opportunity to study how its response changed across structural conditions. We used five accelerometers and three states: one undamaged condition and two damaged conditions. 1
The approach combined a sparse autoencoder with a statistical measure of distance. An autoencoder learns to reconstruct its input through an internal representation. By limiting that representation and applying a sparsity penalty, we encourage the network to encode useful information compactly.
We divided the acceleration records into roughly five-second segments and transformed them into the frequency domain. For each accelerometer, the autoencoder compressed a 251-value frequency-domain input into 10 features. We then combined the features from all five sensors and compared them with a reference distribution using the Mahalanobis distance, which accounts for the scale and correlations of the features.
The result was a control chart: measurements sufficiently far from the reference distribution indicated a possible change in structural condition. The upper control limit was the reference distribution's 95th percentile. Crossing that threshold was therefore an indication to investigate, rather than proof of damage in an individual sample.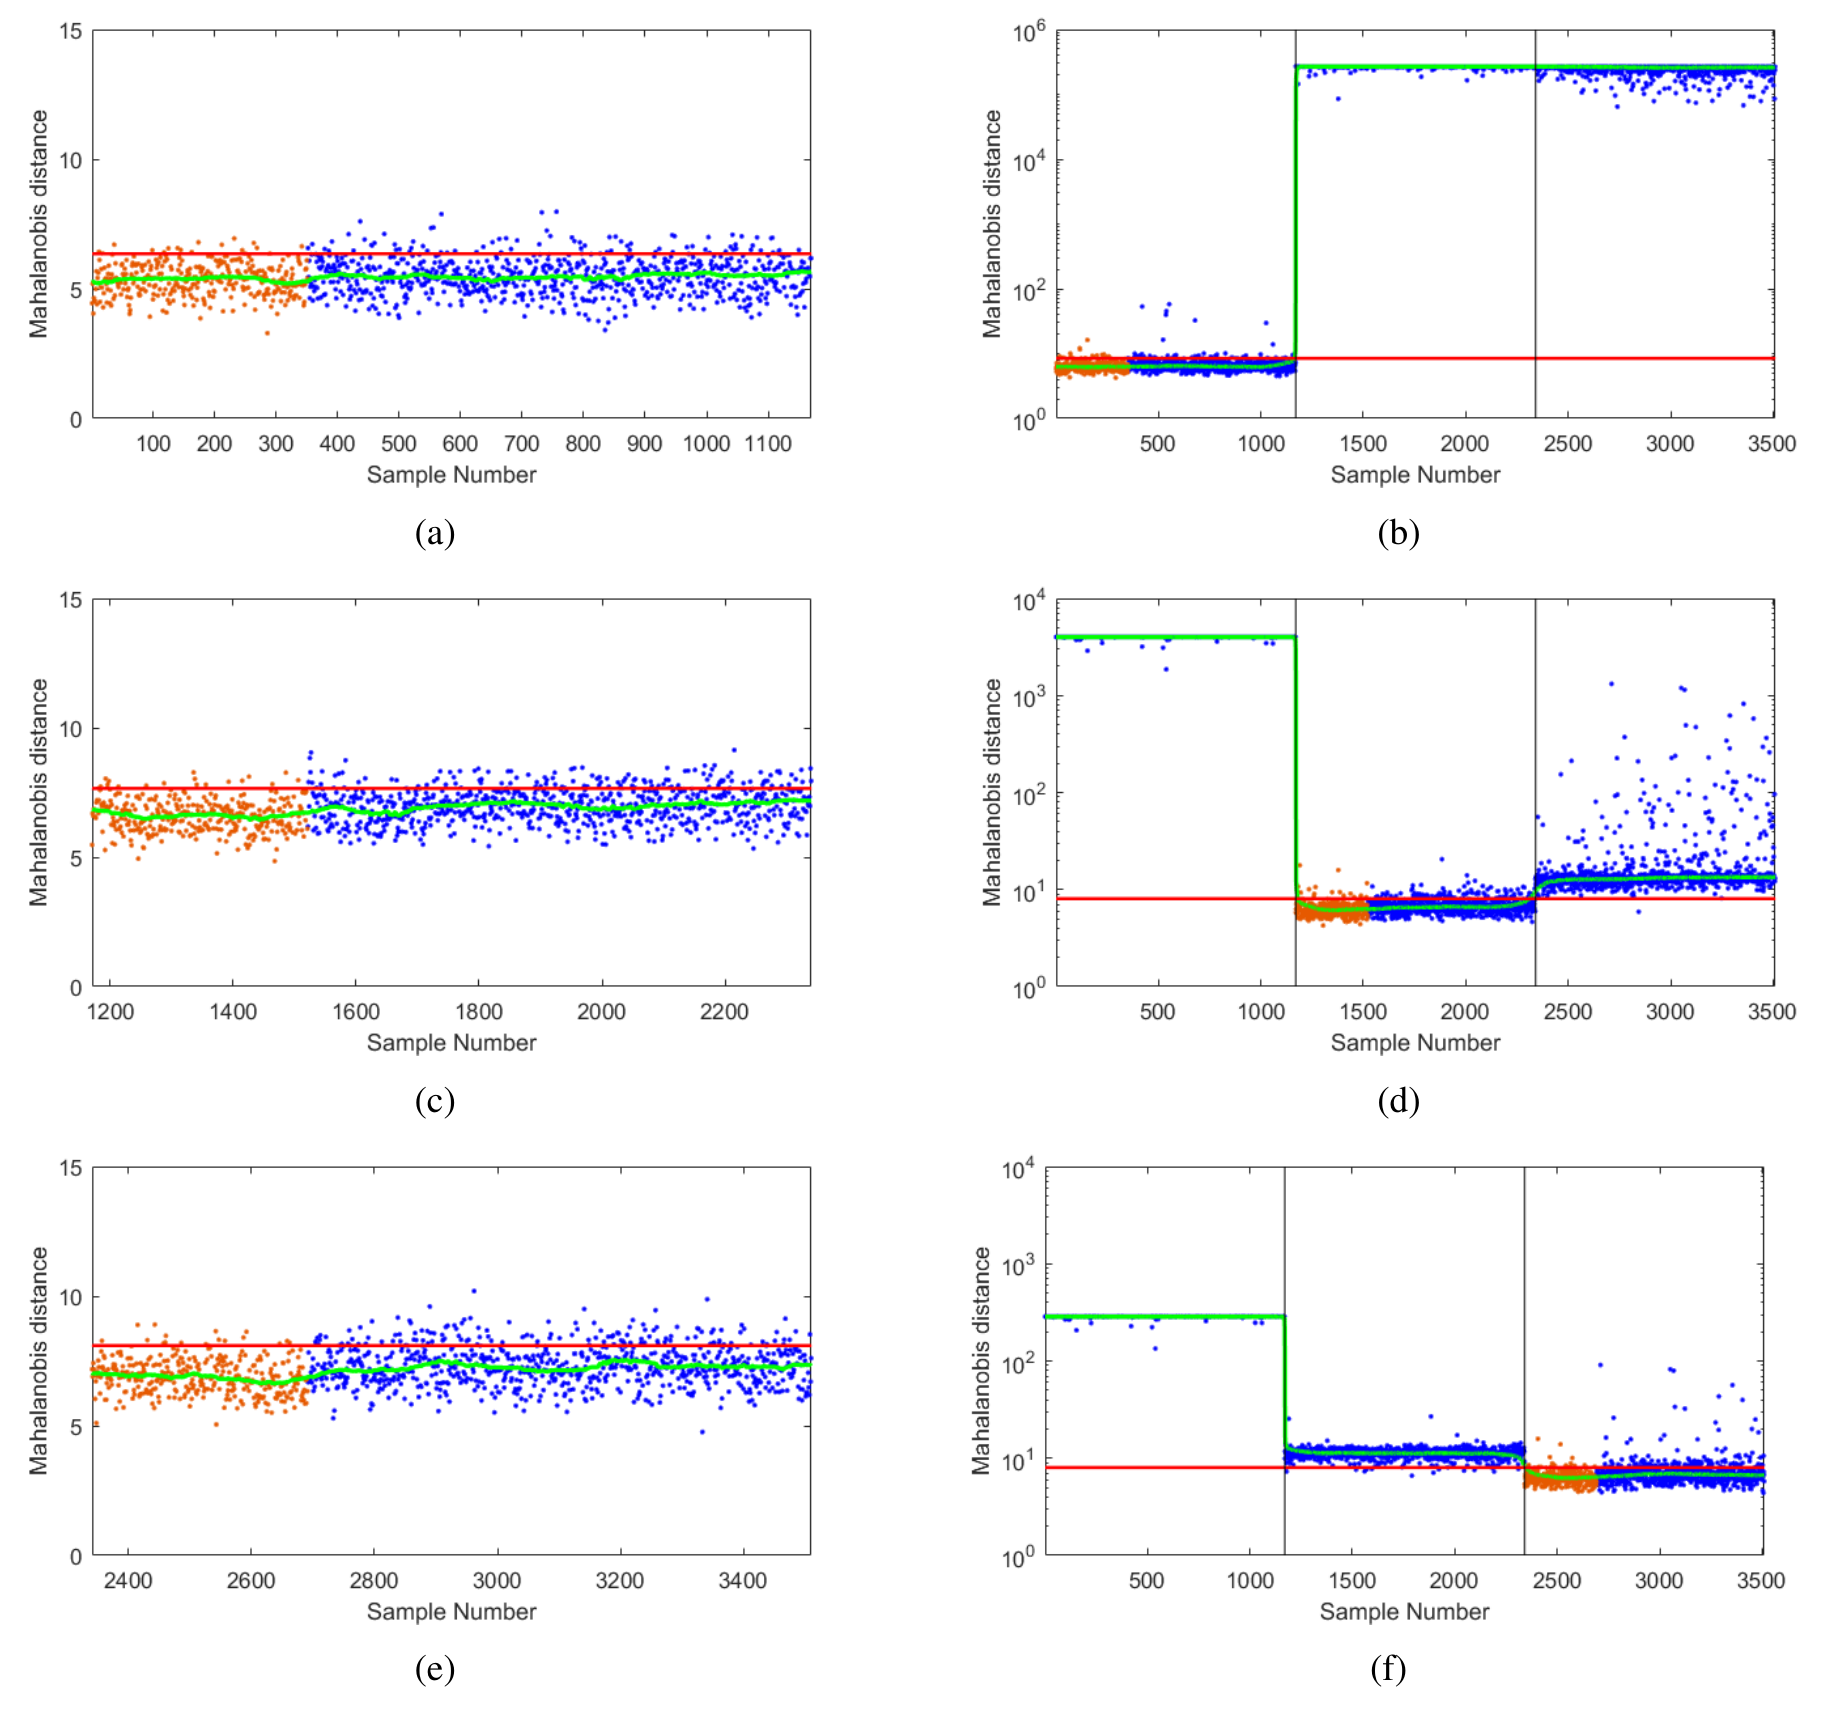
The method separated the three structural conditions, but performance varied across trained models. Some choices, including the number of training samples and the size of the hidden layer, still needed more systematic investigation. Also, the experiment that assessed separation between conditions trained the autoencoders using samples from all three states. Unsupervised feature learning should not be confused with demonstrating detection of entirely unseen damage after training only on healthy data.
Comparing autoencoders and CNNs
That study addressed whether the measured response had changed. Our EVACES 2023 paper explored a different question: how well could two neural-network approaches distinguish known structural conditions when the measurements came from a camera? 2
We tested a polypropylene cantilever beam with a free span of 0.8 m. Successive saw cuts produced seven damaged states in addition to the healthy state. A high-speed camera recorded the beam during free vibration, and image processing extracted its motion at multiple positions.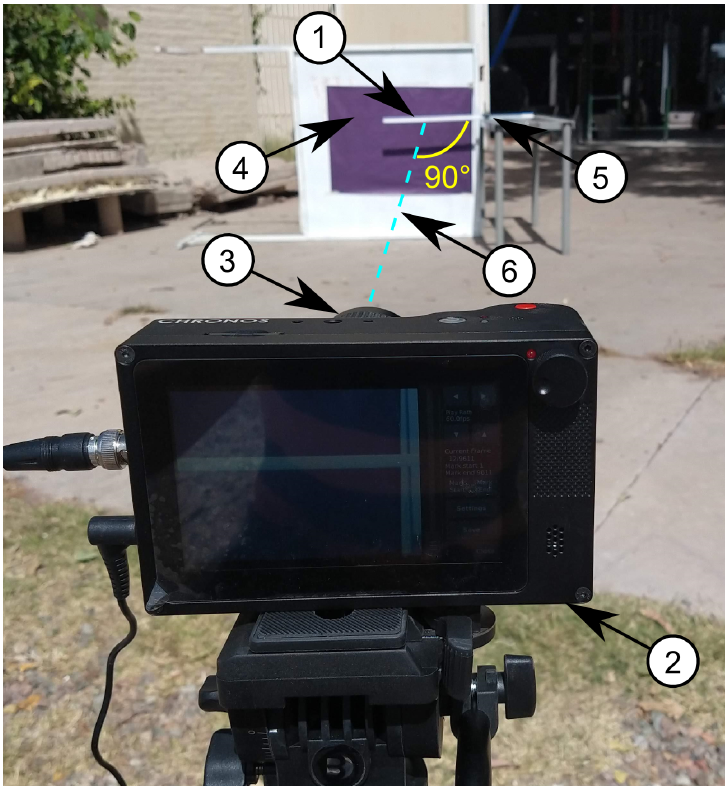
This changes the instrumentation problem. A camera can measure many points within its field of view without attaching a separate sensor at each point. The measurements still depend on visibility, contrast, camera geometry, and image-processing quality, but they provide spatial coverage that is useful for studying deformation.
For the comparison, we used displacement time histories from 40 monitored positions. One approach compressed each signal with a sparse autoencoder and passed the resulting features to a shallow neural-network classifier. The other used a one-dimensional convolutional neural network, or CNN, to learn features and classify the signals within the same model.
With suitable configurations, both approaches achieved 100% classification accuracy in the reported five-fold cross-validation experiment. The CNN reached that performance in approximately half the processing time of the autoencoder-based approach for the tested settings. Those results describe this dataset and these configurations; they do not establish that one architecture will always be faster or more accurate.
Learning from instantaneous beam shapes
Our paper in Structural Health Monitoring made a more fundamental change. Instead of supplying the CNN with the motion of one point over time, we supplied the displacements of 60 points at one instant. 3
The distinction is simple but consequential:
| Representation | What one input contains | What the network can learn |
|---|---|---|
| Displacement time history | Many successive measurements at one position | Temporal patterns in the motion |
| Instantaneous displacement field | Simultaneous measurements at many positions | Spatial patterns in the deformed shape |
For the second representation, convolution operates along the beam. Under the study's assumptions of free vibration and proportional damping, an instantaneous deformed shape combines modal contributions and deflection due to gravity. Those shapes contain information about the structure's stiffness distribution.
The camera frames first went through image processing to extract displacement measurements. Each CNN input therefore contained 60 numerical values, rather than the full image. This reduced the dimensionality and focused the learning problem on structural deformation.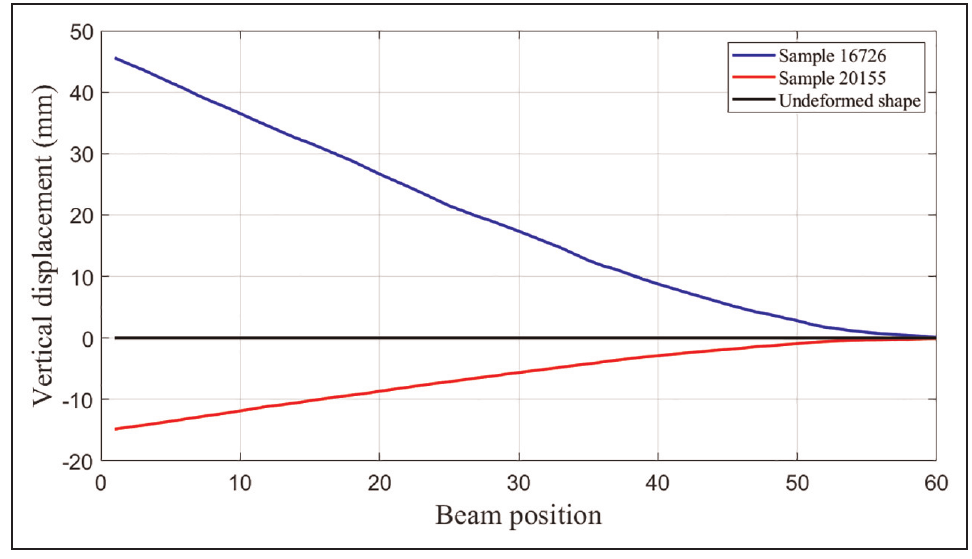
Locating and quantifying damage
The output also changed. Instead of assigning a single scenario label, the network predicted a damage-index profile at the 60 monitored positions. The index was defined as the ratio of healthy flexural rigidity to damaged flexural rigidity. A value of one represented an undamaged region; larger values represented reduced rigidity. Training targets were constructed from the measured crack geometry and an assumed spatial distribution around each crack.
When all eight structural states were represented in training, the predicted profiles closely matched the targets. The reported coefficients of variation at the evaluated crack positions were below 2%. This measures the relative dispersion of predictions; it should not be interpreted as a universal bound on prediction error.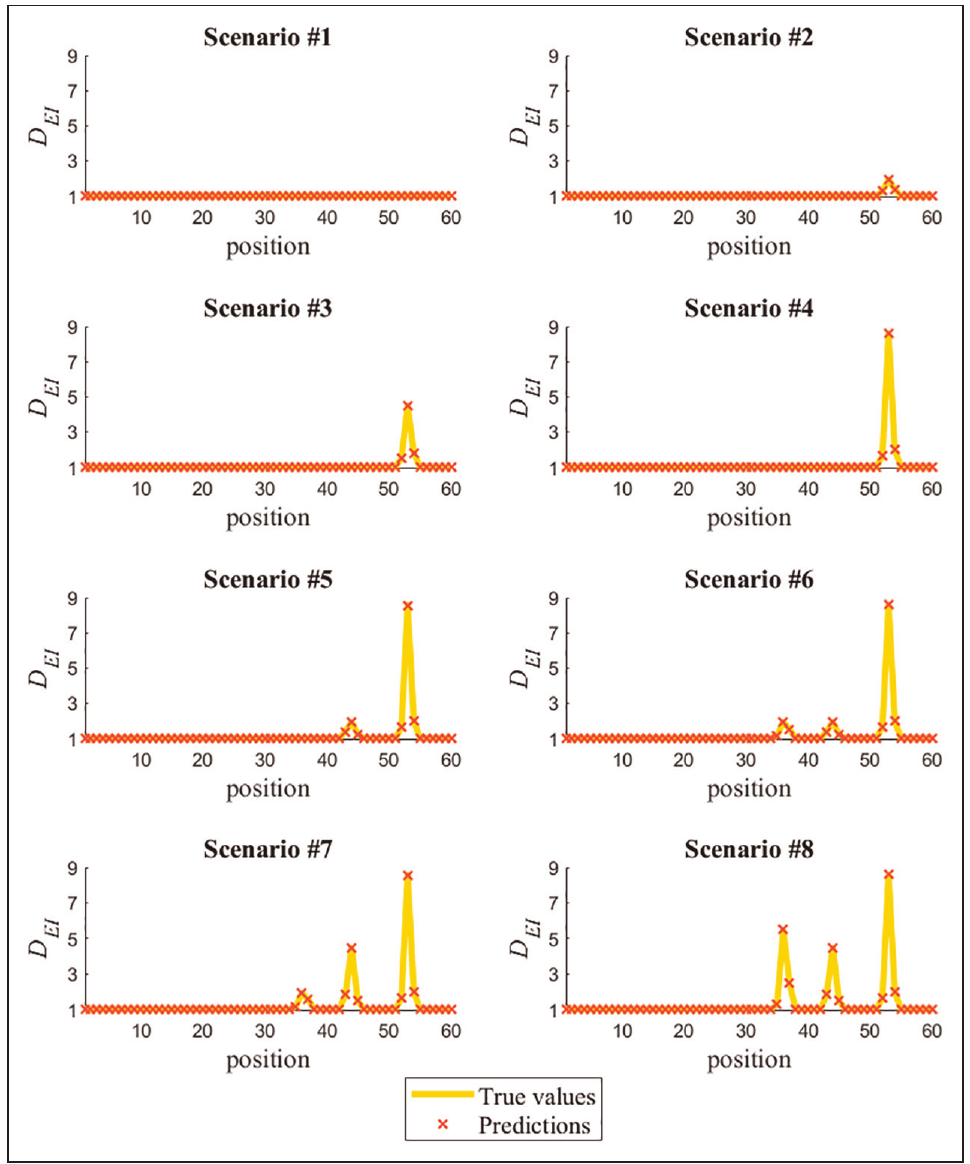
We also combined predictions from multiple snapshots by taking their median. In the experiment with all scenarios represented in training, the median predictions at the evaluated crack positions converged to relative errors below 1% using fewer than 1,500 samples. Most scenarios needed fewer than 500. The smallest crack was the most demanding case.
This is one practical benefit of the spatial representation: the network does not require the snapshots to arrive in time order or form a continuous recording. The spatial ordering of the measurements still matters, and the snapshots must satisfy the measurement and structural conditions assumed by the method.
Testing unseen damage scenarios
We then made the task harder by excluding two damage scenarios from training. The model still detected and located damage across the evaluated scenarios, but its estimates of severity became less accurate. This distinction matters. Finding the affected region and estimating how much stiffness it has lost are separate achievements.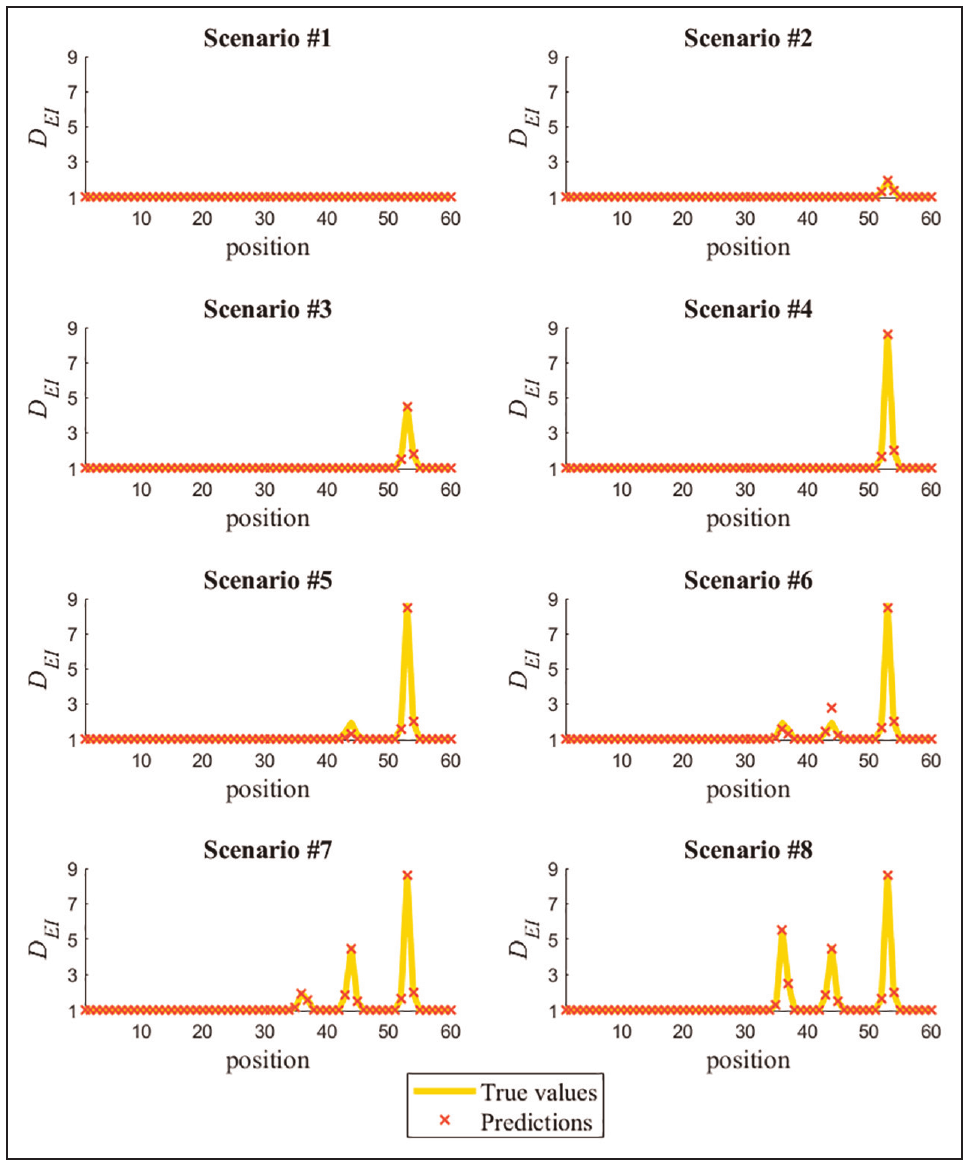
The withheld scenarios came from the same beam and experimental setup. This was evidence of generalization within that experiment, not a demonstration that a trained network could be transferred directly to a different bridge, material, camera arrangement, or damage mechanism.
Lessons for structural monitoring
Taken together, these studies show how measurement choices and learning methods work together. The bridge study used compact spectral features to identify changes in condition. The EVACES comparison used camera-derived time histories to classify known states. The journal study used instantaneous spatial measurements to estimate where damage occurred and how severe it was.
There is still substantial work between these experiments and routine field use. Training data must capture relevant structural and measurement variability. Evaluation on independent recordings, different acquisition conditions, and additional specimens would help establish how well the approach transfers. Temperature changes, camera movement, and changing boundary conditions also need explicit attention.
Papers and downloads
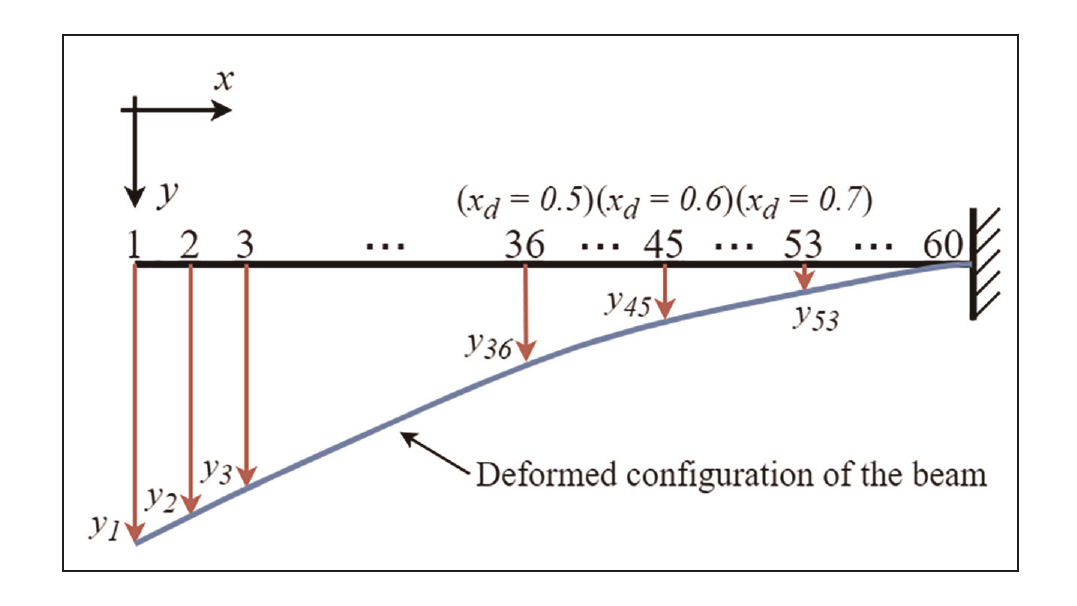
The figures are cropped screen captures from the papers. The cover diagram comes from Figure 3 on PDF page 6 of the Structural Health Monitoring paper.
CILAMCE 2022
Resende, L. V., Finotti, R. P., Barbosa, F. S., and Cury, A. A. (2022). Structural damage detection with autoencoding neural networks.. Proceedings of the XLIII Ibero-Latin-Americhttps://publicacoes.softaliza.com.br/cilamce2022/article/view/5307a.**n Congress on Computational Methods in Engineering (CILAMCE), Foz do Iguaçu, Brazil.
Download CILAMCE paper (PDF, 0.6 MB)
EVACES 2023
Barbosa, F., Resende, L., Finotti, R., Cury, A., Motta, C., Garrido, H., Domizio, M., and Curadelli, O. (2023). Autoencoders and Convolutional Neural Networks Applied to Structural Damage Detection. EVACES 2023.
Download EVACES paper (PDF, 3.8 MB)
Structural Health Monitoring
Resende, L., Finotti, R., Barbosa, F., Garrido, H., Cury, A., and Domizio, M. (2023). Damage identification using convolutional neural networks from instantaneous displacement measurements via image processing. Structural Health Monitoring.